FIGURE 55. CISCO SYSTEMS INC.: NET SALES
Free report update (Within 180 days)
TABLE 51. CHINA INTERNET OF VEHICLE MARKET REVENUE, BY COMMUNICATION TYPE, 20152024 ($MILLION)
FIGURE 04. GLOBAL INTERNET OF VEHICLE MARKET SEGMENTAT
TABLE 65. LATIN AMERICA INTERNET OF VEHICLE MARKET REVENUE, BY COMPONENT, 20172024 ($MILLION)
TABLE 43. REST OF EUROPE INTERNET OF VEHICLE MARKET REVENUE, BY TECHNOLOGY, 20152024 ($MILLION)
4.3.2. Market size and forecast, by region
TABLE 27. MEXICO INTERNET OF VEHICLE MARKET REVENUE, BY TECHNOLOGY, 20152023 ($MILLION)
7.3.4. Market size and forecast, by types of communication
FIGURE 18. CANADA INTERNET OF VEHICLE MARKET, 20172024 ($ MILLION)
FIGURE 43. NXP SEMICONDUCTORS N.V. : NET SALES
TABLE 10. INTERNET OF VEHICLE MARKET REVENUE FOR OTHER TECHNOLOGIES, BY REGION, 2015-2024 ($MILLION)
FIGURE 40. INTEL CORPORATION: REVENUE BY SEGMENT
FIGURE 03. GLOBAL INTERNET OF VEHICLE MARKET: KEY PLAYERS
7.4.9.1. Market size and forecast, by component
UK 3D Rendering Services Market- Opportunity Analysis and Industry Forecast, 2018-2025
7.2.7. Canada Internet of Vehicle market
8.7.5. Key strategic moves and developments
FIGURE 41. INTEL CORPORATION: REVENUE BY GEOGRAPHY
7.5.6.1. Market size and forecast, by component
4.3.1. Key market trends, growth factors and opportunities
TABLE 62. LAMEA INTERNET OF VEHICLE MARKET REVENUE, BY TECHNOLOGY, 20172024 ($MILLION)
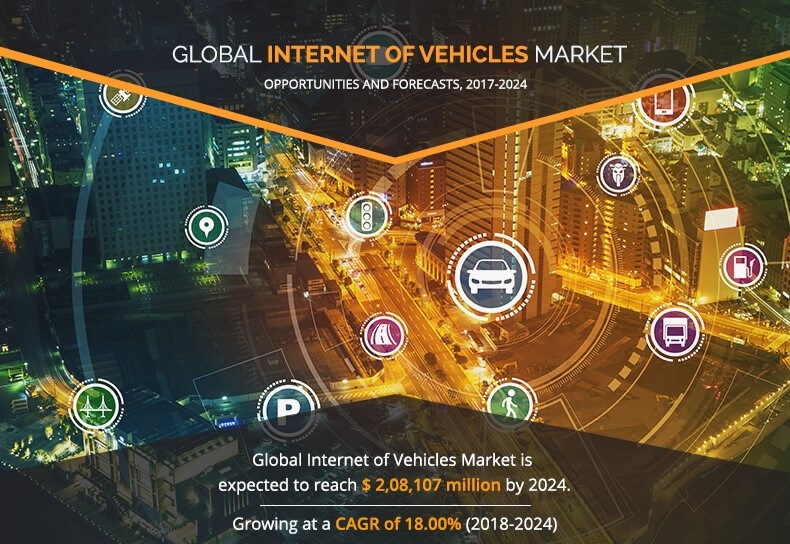
Internet of Vehicles (IoV) helps a vehicle to connect to the nearby vehicle or other traffic infrastructure using a wireless network. Through this technology the vehicles send floating data to the base area located at long distances. It helps the user to locate the vehicle as well as the ones around. In addition to it, the vehicles detect the speed and distance of the nearby vehicle and manage self-speed accordingly. The global internet of vehicles market was valued at $66,075 million in 2017, and is projected to reach at $208,107 million by 2024, growing at a CAGR of 18.00% from 2018 to 2024.
6.3.1. Key market trends, growth factors and opportunities
FIGURE 17. U.S. INTERNET OF VEHICLE MARKET, 20172024 ($ MILLION)
Targeted market view to provide pertinent information and save time of readers
TABLE 42. REST OF EUROPE INTERNET OF VEHICLE MARKET REVENUE, BY COMPONENT, 20152024 ($MILLION)
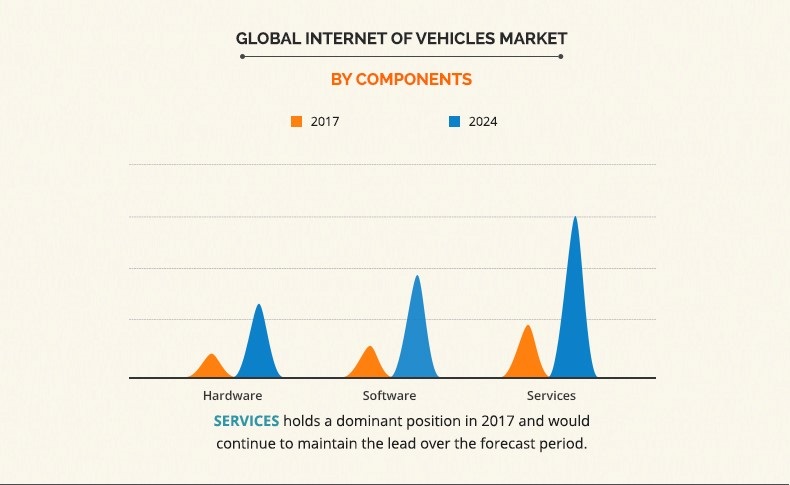
Global Internet of Vehicles Market By Components
8.4.5. Key strategic moves and developments
FIGURE 11. MODERATE BARGAINING POWER OF SUPPLIERS
The future of IoV lies in the automation of vehicles. With the advancement of technology, the vehicles are geared up to slow down the speed after avoiding the warnings, on detection of any vehicle nearby and further, if necessary apply brakes or turn the wheels. The next generation of IoV would see a fully automated driver car.
4.4.2. Market size and forecast, by region
3.5.3.2. Introduction of 5G technology and globalization
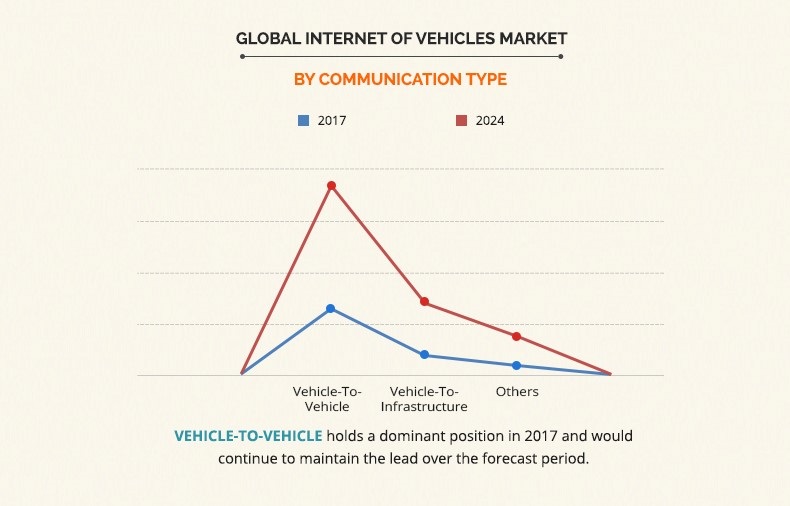
Global Internet of Vehicles Market By Communication Type
TABLE 15. GLOBAL INTERNET OF VEHICLE MARKET REVENUE, BY GEOGRAPHY, 20152024 ($MILLION)
TABLE 26. MEXICO INTERNET OF VEHICLE MARKET REVENUE, BY COMPONENT, 20152024 ($MILLION)
TABLE 38. FRANCE INTERNET OF VEHICLE MARKET REVENUE, BY COMMUNICATION TYPE, 20152024 ($MILLION)
TABLE 66. LATIN AMERICA INTERNET OF VEHICLE MARKET REVENUE, BY TECHNOLOGY, 20172024 ($MILLION)
FIGURE 57. CISCO SYSTEMS INC.: REVENUE BY GEOGRAPHY
7.5.7.1. Market size and forecast, by component
Internet of Vehicle Market Key Segments:
7.3.6.1. Market size and forecast, by component
7.4.8.3. Market size and forecast, by communication type
7.5.6. Latin America Internet of Vehicle market
5.4.1. Key market trends, growth factors and opportunities
6.2.2. Market size and forecast, by region
7.5.6.3. Market size and forecast, by communication type
7.2.1. Key market trends, growth factors and opportunities
5.5.2. Market size and forecast, by region
7.4.8. India Internet of Vehicle market
7.4.8.1. Market size and forecast, by component
7.2.7.1. Market size and forecast, by component
FIGURE 27. REST OF ASIA-PACIFIC INTERNET OF VEHICLE MARKET, 2016-2024 ($MILLION)
TABLE 28. MEXICO INTERNET OF VEHICLE MARKET REVENUE, BY COMMUNICATION TYPES, 20152024 ($MILLION)
5.3.2. Market size and forecast, by region
7.4.7.1. Market size and forecast, by component

7.4.6. China Internet of Vehicle market
The current market is quantitatively analyzed from 2017 to 2024 to highlight the financial competency of the industry.
FIGURE 13. MODERATE THREAT OF SUBSTITUTES
7.3.3. Market size and forecast, by technology
FIGURE 52. IBM CORPORATION: NET SALES
FIGURE 31. FORD MOTOR COMPANY: NET SALES
7.4.9. Rest of Asia-Pacific Internet of Vehicle market
FIGURE 39. INTEL CORPORATION.: NET SALES
4.2.1. Key market trends, growth factors and opportunities
7.2.2. Market size and forecast, by component
FIGURE 25. JAPAN INTERNET OF VEHICLE MARKET, 2017-2024 ($MILLION)
TABLE 61. LAMEA INTERNET OF VEHICLE MARKET REVENUE, BY COMPONENT, 20172024 ($MILLION)
FIGURE 12. MODERATE THREAT OF NEW ENTRANTS
7.2.7.2. Market size and forecast, by technology
Internet of Vehicle Market by Component (Hardware, Software, and Service), Technology (Bluetooth, Cellular, Wi-Fi, NFC, and Others), and Communication Type (Vehicle-to-Vehicle, Vehicle-to-Infrastructure, and Others) – Global Opportunity Analysis and Industry Forecast, 2017-2024
TABLE 22. U.S. INTERNET OF VEHICLE MARKET REVENUE, BY COMMUNICATION TYPE, 20152024 ($MILLION)
5.2.1. Key market trends, growth factors and opportunities
market of ICT & Media on Knowledge Tree Platform
Chapter: 4: INTERNET OF VEHICLE MARKET, BY COMPONENT
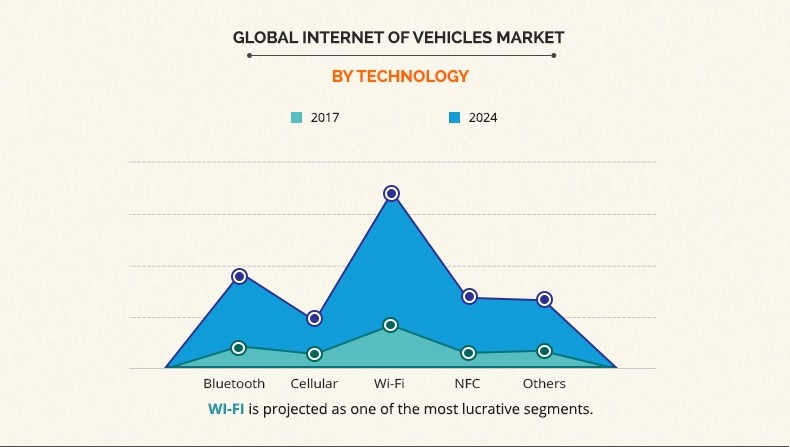
Global Internet of Vehicles Market By Technology
FIGURE 01. GLOBAL INTERNET OF VEHICLE MARKET, 20172024
7.2.3. Market size and forecast, by technology
7.5.8.3. Market size and forecast, by communication type
7.5.3. Market size and forecast, by technology
8.8.5. Key strategic moves and developments
8.10.5. Key strategic moves and developments
TABLE 29. EUROPE INTERNET OF VEHICLE MARKET REVENUE, BY COMPONENT, 20152024 ($MILLION)
TABLE 18. NORTH AMERICA INTERNET OF VEHICLE MARKET REVENUE, COMMUNICATION TYPES, 20152024 ($MILLION)
Get more information on this report :Request Sample Pages
The report presents information related to key drivers, restraints, and opportunities.
7.3.7. France Internet of Vehicle market
7.3.9.2. Market size and forecast, by technology
TABLE 59. REST OF ASIA-PACIFIC INTERNET OF VEHICLE MARKET REVENUE, BY TECHNOLOGY, 20172024 ($MILLION)
FIGURE 30. AFRICA INTERNET OF VEHICLE MARKET, 2017-2024($ MILLION)
TABLE 70. MIDDLE EAST INTERNET OF VEHICLE MARKET REVENUE, BY COMMUNICATION TYPE, 2015-2024($MILLION)
7.4.6.1. Market size and forecast, by component
FIGURE 36. TEXAS INSTRUMENTS INC: REVENUE BY GEOGRAPHY
Get insights on topics that are crucial for your business. Stay abreast of your interest areas.
TABLE 04. INTERNET OF VEHICLE MARKET REVENUE FOR SERVICES, BY REGION, 20152024 ($MILLION)
TABLE 07. INTERNET OF VEHICLE MARKET REVENUE FOR BLUETOOTH, BY REGION, 20152024 ($MILLION)
FIGURE 22. GERMANY INTERNET OF VEHICLE MARKET, 2017-2024 ($MILLION)
FIGURE 19. MEXICO INTERNET OF VEHICLE MARKET, 20172024 ($ MILLION)
TABLE 06. INTERNET OF VEHICLE MARKET REVENUE FOR WI-FI, BY REGION, 20152024 ($MILLION)
FIGURE 28. LATIN AMERICA INTERNET OF VEHICLE, 2017-2024 ($MILLION)
7.4.4. Market size and forecast, by communication type
TABLE 19. NORTH AMERICA INTERNET OF VEHICLE MARKET REVENUE, BY COUNTRY, 20152024 ($MILLION)
7.3.5. Market size and forecast, by country
FIGURE 09. TOP WINNING STRATEGIES, BY COMPANY
TABLE 03. INTERNET OF VEHICLE MARKET REVENUE FOR SOFTWARE, BY REGION, 20152024 ($MILLION)
FIGURE 34. TEXAS INSTRUMENTS INC: NET SALES
FIGURE 45. MICROSOFT CORPORATION: REVENUE BY GEOGRAPHY
TABLE 20. U.S. INTERNET OF VEHICLE MARKET REVENUE, BY COMPONENT, 20152024 ($MILLION)
7.5.1. Key market trends, growth factors and opportunities
7.2.6.3. Market size and forecast, by communication type
FIGURE 35. TEXAS INSTRUMENTS INC: REVENUE BY SEGMENT
7.4.7.3. Market size and forecast, by communication type
TABLE 33. UK INTERNET OF VEHICLE MARKET REVENUE, BY COMPONENT, 20172023 ($MILLION)
7.3.7.3. Market size and forecast, by communication type
The Wi-Fi segment led the market in 2017 and is expected to remain dominant in future. Furthermore, the vehicle-to vehicle communication segment dominated the overall internet of vehicle market share in the same year.
FIGURE 26. INDIA INTERNET OF VEHICLE MARKET,2016-2024($MILLION)

FIGURE 29. MIDDLE EAST INTERNET OF VEHICLE MARKET, 2016-2024 ($MILLION)
TABLE 54. JAPAN INTERNET OF VEHICLE MARKET REVENUE, BY COMMUNICATION TYPE, 20152023 ($MILLION)
Internet of vehicles uses hardware and software automation, and incorporation of various technologies. The internet of vehicle market is expected to witness an increase in demand for road safety and rise in adoption of IoT in vehicles. This technology helps vehicles to connect to adjacent vehicles or other traffic infrastructure in the field of wireless network. Using this technology, vehicles can send floating data to the base station situated at any location. In addition, it helps users to locate vehicles as well as in the nearby area. Some of the examples of communication types include vehicle-to-vehicle, vehicle-to-infrastructure, and others.
TABLE 09. INTERNET OF VEHICLE MARKET REVENUE FOR CELLULAR, BY REGION, 20152024 ($MILLION)
8.3.5. Key strategic moves and developments
TABLE 37. FRANCE INTERNET OF VEHICLE MARKET REVENUE, BY TECHNOLOGY, 20152024 ($MILLION)
8.5.5. Key strategic moves and developments
7.3.9. Rest of Europe Internet of Vehicle market
FIGURE 02. GLOBAL INTERNET OF VEHICLE MARKET, BY REGION, 20172024
Many organizations and personal user are adopting internet of vehicles, as it helps them to track fleet, trains, buses, and cars. IoV uses the sensors and presently available mobile phones and other gadgets to further the mobility of. In addition, the moving vehicles transmit a lot of information while travelling and cloud services provide the required platform. This in turn boosts the adoption of internet of vehicle.
For instance, Fiat Chrysler Automobiles (FCA) collaborated with Waymo, a leading a self-driving technology company in 2016, to launch fully automated driving cars. In addition, FCA joined forces with BMW Group, Intel Corporation, and Mobileye, an Intel company in July 2016 to develop self-driving vehicles by collaborating to bring solutions for highly automated driving (Level 3) and fully automated driving (Level 4/5) into production by 2021.
*Taxes/Fees, if applicable will be added during checkout. All prices in USD
TABLE 44. REST OF EUROPE INTERNET OF VEHICLE MARKET REVENUE, BY COMMUNICATION TYPE, 20152024 ($MILLION)
A vehicular GID is a communication gateway and is integrated with the global universal network connectivity. It is a smart in-vehicle sensor that provides global positioning, online identification of the vehicle, and the name of its owner. It acts as a virtual license plate of the vehicle. GID increases the usability of IoV; thus, fueling the market growth.
Artificial Intelligence in Manufacturing Market- Global Opportunity Analysis and Industry Forecast, 2018-2025
Get more information on this report :Request Sample Pages
FIGURE 23. REST OF EUROPE INTERNET OF VEHICLE MARKET,2017-2024 ($MILLION)
The report focuses on the growth prospects and restraints of the market based on the analysis of regional trends. The Porters five forces analysis of the industry helps understand the impact of various factors such as bargaining power of suppliers, competitive intensity of competitors, threat of new entrants, threat of substitutes, and bargaining power of buyers on the internet of vehicle market growth.
7.3.9.1. Market size and forecast, by component
FIGURE 42. SAP CORPORATION.: NET SALES
TABLE 40. GERMANY INTERNET OF VEHICLE MARKET REVENUE, BY TECHNOLOGY, 20152024 ($MILLION)
Factors such as rising internet penetration, growth associated with connected devices, increase in presence of automation solutions in automotive industry, introduction of Logistics4.0, drive the internet of vehicle market growth. However, inefficiency in determining the exact vehicle position and loss of floating data due to obstacles are expected to hamper the market growth during the forecast period.
TABLE 24. CANADA INTERNET OF VEHICLE MARKET REVENUE, BY TECHNOLOGY, 20152024 ($MILLION)
5.6.1. Key market trends, growth factors and opportunities
FIGURE 47. APPLE INC.: REVENUE BY PRODUCT
8.1.5. Key strategic moves and developments
5.6.2. Market size and forecast, by region
TABLE 69. MIDDLE EAST INTERNET OF VEHICLE MARKET REVENUE, BY TECHNOLOGY, 20172024 ($MILLION)
FIGURE 53. IBM CORPORATIOPN.: REVENUE BY PRODUCT
TABLE 14. INTERNET OF VEHICLE MARKET REVENUE FOR OTHER COMMUNICATIONS, BY REGION, 20152024 ($MILLION)
TABLE 72. AFRICA INTERNET OF VEHICLE MARKET REVENUE, BY TECHNOLOGY, 2015-2024($MILLION)
Chapter: 5: INTERNET OF VEHICLE MARKET, BY TECHNOLOGY
FIGURE 33. FORD MOTOR COMPANY: REVENUE BY GEOGRAPHY
7.4.9.3. Market size and forecast, by communication type
FIGURE 10. HIGH BARGAINING POWER OF BUYERS
7.3.6.2. Market size and forecast, by technology
TABLE 35. UK INTERNET OF VEHICLE MARKET REVENUE, BY COMMUNICATION TYPE, 20152024 ($MILLION)
To ensure high level data integrity, accurate analysis and impeccable forecasts
7.5.8.1. Market size and forecast, by component
CAM Software Market- Global Opportunity Analysis and Industry Forecast, 2018-2025
FIGURE 15. MARKET PLAYER POSITIONING
TABLE 55. INDIA INTERNET OF VEHICLE MARKET REVENUE, BY COMPONENT, 20172024 ($MILLION)
7.2.6.2. Market size and forecast, by technology
TABLE 57. INDIA INTERNET OF VEHICLE MARKET REVENUE, BY COMMUNICATION TYPE, 20172023 ($MILLION)
Free report update (Within 180 days)
7.2.8.1. Market size and forecast, by component
7.5.7.2. Market size and forecast, by technology
TABLE 01. GLOBAL INTERNET OF VEHICLE MARKET REVENUE, BY COMPONENT, 20152024 ($MILLION)

Get more information on this report :Request Sample Pages
FIGURE 50. GOOGLE INC.: REVENUE BY PRODUCT
7.3.7.2. Market size and forecast, by technology
TABLE 71. AFRICA INTERNET OF VEHICLE MARKET REVENUE, BY COMPONENT, 2015-2024($MILLION)
TABLE 58. REST OF ASIA-PACIFIC INTERNET OF VEHICLE MARKET REVENUE, BY COMPONENT, 20172024 ($MILLION)
TABLE 45. ASIA-PACIFIC INTERNET OF VEHICLE MARKET REVENUE, BY COMPONENT, 20152024 ($MILLION)
Emergence of Global Identification (GID)
TABLE 64. LAMEA INTERNET OF VEHICLE MARKET REVENUE, BY COUNTRY, 20172024 ($MILLION)
7.2.8. Mexico Internet of Vehicle market
7.2.7.3. Market size and forecast, by communication type
FIGURE 54. IBM CORPORATION: REVENUE BY GEOGRAPHY
3.2.3.3. Top winning strategies, by company
Restricted Print, copy, paste,download
TABLE 17. NORTH AMERICA INTERNET OF VEHICLE MARKET REVENUE, BY TECHNOLOGY, 20152024 ($MILLION)
TABLE 63. LAMEA INTERNET OF VEHICLE MARKET REVENUE, BY TYPE OF COMMUNICATION, 20172024 ($MILLION)
FIGURE 56. CISCO SYSTEMS INC..: REVENUE BY PRODUCT
8.2.5. Key strategic moves and developments
© 2018 Allied Market Research. All Rights Reserved
7.5.4. Market size and forecast, by type of communication
Penetration of IoT and Cloud Services
FIGURE 38. AUDI AG: REVENUE BY SEGMENT

7.3.8.2. Market size and forecast, by technology
TABLE 34. UK INTERNET OF VEHICLE MARKET REVENUE, BY TECHNOLOGY, 20152024 ($MILLION)
7.3.6.3. Market size and forecast, by communication type
7.4.7.2. Market size and forecast, by technology
FIGURE 21. FRANCE INTERNET OF VEHICLE MARKET, 2017-2024($MILLION)
7.3.2. Market size and forecast, by component
4.2.2. Market size and forecast, by region
7.4.2. Market size and forecast, by component
7.5.8.2. Market size and forecast, by technology
Periodic launches of new and improved technologies and progressive enhancement from manual cognitive for automated cognitive fuel the market growth. Innovations in GID has improved security and increased opportunities in the global internet of vehicle market. Furthermore, introduction of 5G technology and incorporation of this technology with IoV ensure that floating data is transmitted efficiently and reduce the chances of data loss. These factors are expected to boost the growth of the market.
The increased demand for GID, which is a prominent part ofinternet of vehicle market, is on a significant rise due to the security of the vehicle and safety issues which drives the growth of the internet of vehicle market.
Chapter: 6: INTERNET OF VEHICLE MARKET, BY COMMUNICATION TYPE
TABLE 39. GERMANY INTERNET OF VEHICLE MARKET REVENUE, BY COMPONENT, 20152024 ($MILLION)
7.3.9.3. Market size and forecast, by communication type
6.4.1. Key market trends, growth factors and opportunities
7.2.6.1. Market size and forecast, by component
7.3.8.3. Market size and forecast, by type of communication
7.4.3. Market size and forecast, by technology
TABLE 21. U.S. INTERNET OF VEHICLE MARKET REVENUE, BY TECHNOLOGY, 20152024 ($MILLION)
Europe Debt Collection Software Market- Global Opportunity Analysis and Industry Forecast, 2018-2025
7.3.8.1. Market size and forecast, by component
FIGURE 16. DRIVERS, RESTRAINTS, AND OPPORTUNITIES
7.4.5. Market size and forecast, by country
TABLE 36. FRANCE INTERNET OF VEHICLE MARKET REVENUE, BY COMPONENT, 20152023 ($MILLION)
The key players operating in the global internet of vehicles market include Ford Motor Co., Texas Instruments Inc., Audi AG, Intel Corporation, SAP, NXP semiconductors, Apple Inc., Google Inc., IBM Corporation, and Cisco Systems Inc.
7.2.4. Market size and forecast, by types of communication
7.2.8.2. Market size and forecast, by technology
Internet of Vehicle Market- Global Opportunity Analysis and Industry Forecast, 2017-2024
TABLE 46. ASIA-PACIFIC INTERNET OF VEHICLE MARKET REVENUE, BY TECHNOLOGY, 20152024 ($MILLION)
TABLE 49. CHINA INTERNET OF VEHICLE MARKET REVENUE, BY COMPONENT, 20152024 ($MILLION)
FIGURE 32. FORD MOTOR COMPANY: REVENUE BY SEGMENT
FIGURE 48. APPLE INC.: REVENUE BY GEOGRAPHY
added during checkout. All prices in USD.
FIGURE 44. NXP SEMICONDUCTORS N.V.: REVENUE BY PRODUCT
3.5.1.2. Adoption of IoT and cloud service
TABLE 53. JAPAN INTERNET OF VEHICLE MARKET REVENUE, BY TECHNOLOGY, 20152024 ($MILLION)
TABLE 52. JAPAN INTERNET OF VEHICLE MARKET REVENUE, BY COMPONENT, 20152024 ($MILLION)
TABLE 02. INTERNET OF VEHICLE MARKET REVENUE FOR HARDWARE, BY REGION, 20152024 ($MILLION)
TABLE 32. EUROPE INTERNET OF VEHICLE MARKET REVENUE, BY COUNTRY, 20152024 ($MILLION)
TABLE 68. MIDDLE EAST INTERNET OF VEHICLE MARKET REVENUE, BY COMPONENT, 20172024 ($MILLION)
FIGURE 24. CHINA INTERNET OF VEHICLE MARKET, 2017-2024 ($MILLION)
Get more information on this report :Request Sample Pages
Free report update (Within 180 days)
7.4.6.3. Market size and forecast, by communication type
Free report update (Within 180 days)
TABLE 05. GLOBAL INTERNET OF VEHICLE MARKET REVENUE, BY TECHNOLOGY, 20152024 ($MILLION)
7.5.7. Middle East Internet of Vehicle market
TABLE 56. INDIA INTERNET OF VEHICLE MARKET REVENUE, BY TECHNOLOGY, 20172024 ($MILLION)
TABLE 41. GERMANY INTERNET OF VEHICLE MARKET REVENUE, BY COMMUNICATION TYPE, 20152023 ($MILLION)
6.3.2. Market size and forecast, by region
7.5.8. Africa Internet of Vehicle market
7.2.5. Market size and forecast, by country
TABLE 30. EUROPE INTERNET OF VEHICLE MARKET REVENUE, BY TECHNOLOGY, 20152024 ($MILLION)
6.4.2. Market size and forecast, by region
TABLE 23. CANADA INTERNET OF VEHICLE MARKET REVENUE, BY COMPONENT, 20152024 ($MILLION)
On-demand customization of scope of the report to exactly meet your needs
5.4.2. Market size and forecast, by region
Increase in demand for vehicle tracking and driver safety and surge in adoption of IoT and cloud services are the major factors that fuel the growth of the internet of vehicle market. However, factors such as inefficiency in determining the exact vehicle position and loss of data due to obstacles such as landscapes hamper the market growth to a certain extent.
TABLE 12. INTERNET OF VEHICLE MARKET REVENUE FOR V2V COMMUNICATION, BY REGION, 20152024 ($MILLION)
4.4.1. Key market trends, growth factors and opportunities
7.3.6. UK Internet of Vehicle market
7.3.8. Germany Internet of Vehicle market
TABLE 13. INTERNET OF VEHICLE MARKET REVENUE FOR V2I, BY REGION, 20152024 ($MILLION)
3.5.2.1. Inefficient positioning of vehicle.
7.5.5. Market size and forecast, by country
7.5.6.2. Market size and forecast, by technology
7.4.1. Key market trends, growth factors and opportunities
7.4.6.2. Market size and forecast, by technology
TABLE 60. REST OF ASIA-PACIFIC INTERNET OF VEHICLE MARKET REVENUE, BY COMMUNICATION TYPE, 20172023 ($MILLION)
FIGURE 08. TOP WINNING STRATEGIES, BY DEVELOPMENT
TABLE 25. CANADA INTERNET OF VEHICLE MARKET REVENUE, BY COMMUNICATION TYPES, 20152024 ($MILLION)
5.5.1. Key market trends, growth factors and opportunities
TABLE 67. LATIN AMERICA INTERNET OF VEHICLE MARKET REVENUE, BY COMMUNICATION TYPE, 20172024 ($MILLION)
TABLE 47. ASIA-PACIFIC INTERNET OF VEHICLE MARKET REVENUE, BY COMMUNICATION TYPE, 20152024 ($MILLION)
3.5.1.1. Rise in the trends of vehicle tracking and safety
7.5.2. Market size and forecast, by component
FIGURE 51. GOOGLE INC.: REVENUE BY GEOGRAPHY
7.5.7.3. Market size and forecast, by communication type
The global internet of vehicles market is segmented into component, technology, communication type and region. Based on component, it is divided into hardware, software, and service. Based on technology, it is classified into Bluetooth, cellular, Wi-Fi, NFC, and others. By communication type, it is categorized into vehicle-to-vehicle, vehicle-to-infrastructure, and others. By region, it is analyzed across North America, Europe, Asia-Pacific, and LAMEA.
8.9.5. Key strategic moves and developments
TABLE 16. NORTH AMERICA INTERNET OF VEHICLE MARKET REVENUE, BY COMPONENT, 20152024 ($MILLION)
7.2.6. U.S. Internet of Vehicle market
7.3.7.1. Market size and forecast, by component
5.2.2. Market size and forecast, by region
7.4.7. Japan Internet of Vehicle market
3.3. PORTERS FIVE FORCES ANALYSIS
TABLE 48. ASIA-PACIFIC INTERNET OF VEHICLE MARKET REVENUE, BY COUNTRY, 20152024 ($MILLION)
TABLE 50. CHINA INTERNET OF VEHICLE MARKET REVENUE, BY TECHNOLOGY, 20152024 ($MILLION)
TABLE 31. EUROPE INTERNET OF VEHICLE MARKET REVENUE, BY TYPE OF COMMUNICATION, 20152024 ($MILLION)
TABLE 11. GLOBAL INTERNET OF VEHICLE MARKET REVENUE, BY COMMUNICATION TYPE, 20152024 ($MILLION)
In 2017, North America was the highest contributor, in terms of revenue, in the internet of vehicle market. In addition, vehicle-to-infrastructure segment has contributed significantly to the revenue to the market in North America. Furthermore, Wi-Fi technology segment is anticipated to witness the highest growth rate during the forecast period, due to heavy investment across developing nations.
7.2.8.3. Market size and forecast, by communication type
Prominent players have adopted various strategies, such as new product launch, business expansion, and strategic alliances to increase awareness about mining automation across various countries to strengthen their position and enhance the internet of vehicle market share.
TABLE 73. AFRICA INTERNET OF VEHICLE MARKET REVENUE, BY COMMUNICATION TYPE, 2015-2024($MILLION)
5.3.1. Key market trends, growth factors and opportunities
FIGURE 20. UK INTERNET OF VEHICLE MARKET, 2017-2024 ($MILLIONS)
Porters five forces analysis illustrates the potency of buyers & suppliers in the global internet of vehicles industry.
TABLE 08. INTERNET OF VEHICLE MARKET REVENUE FOR NFC, BY REGION, 20152024 ($MILLION)
6.2.1. Key market trends, growth factors and opportunities
7.3.1. Key market trends, growth factors and opportunities
7.4.9.2. Market size and forecast, by technology
This study includes the analytical depiction of the global internet of vehicles market along with the current trends and future estimations to determine the imminent investment pockets.
Chapter: 7: INTERNET OF VEHICLE MARKET, BY GEOGRAPHY
7.4.8.2. Market size and forecast, by technology
8.6.5. Key strategic moves and developments
